Replace the plot average with a species map of every compartment.
Tree Species Mapping classifies conifer and broadleaf, and often species from species, across your whole holding once a year, so the plan starts from what the canopy shows instead of what the plots imply.
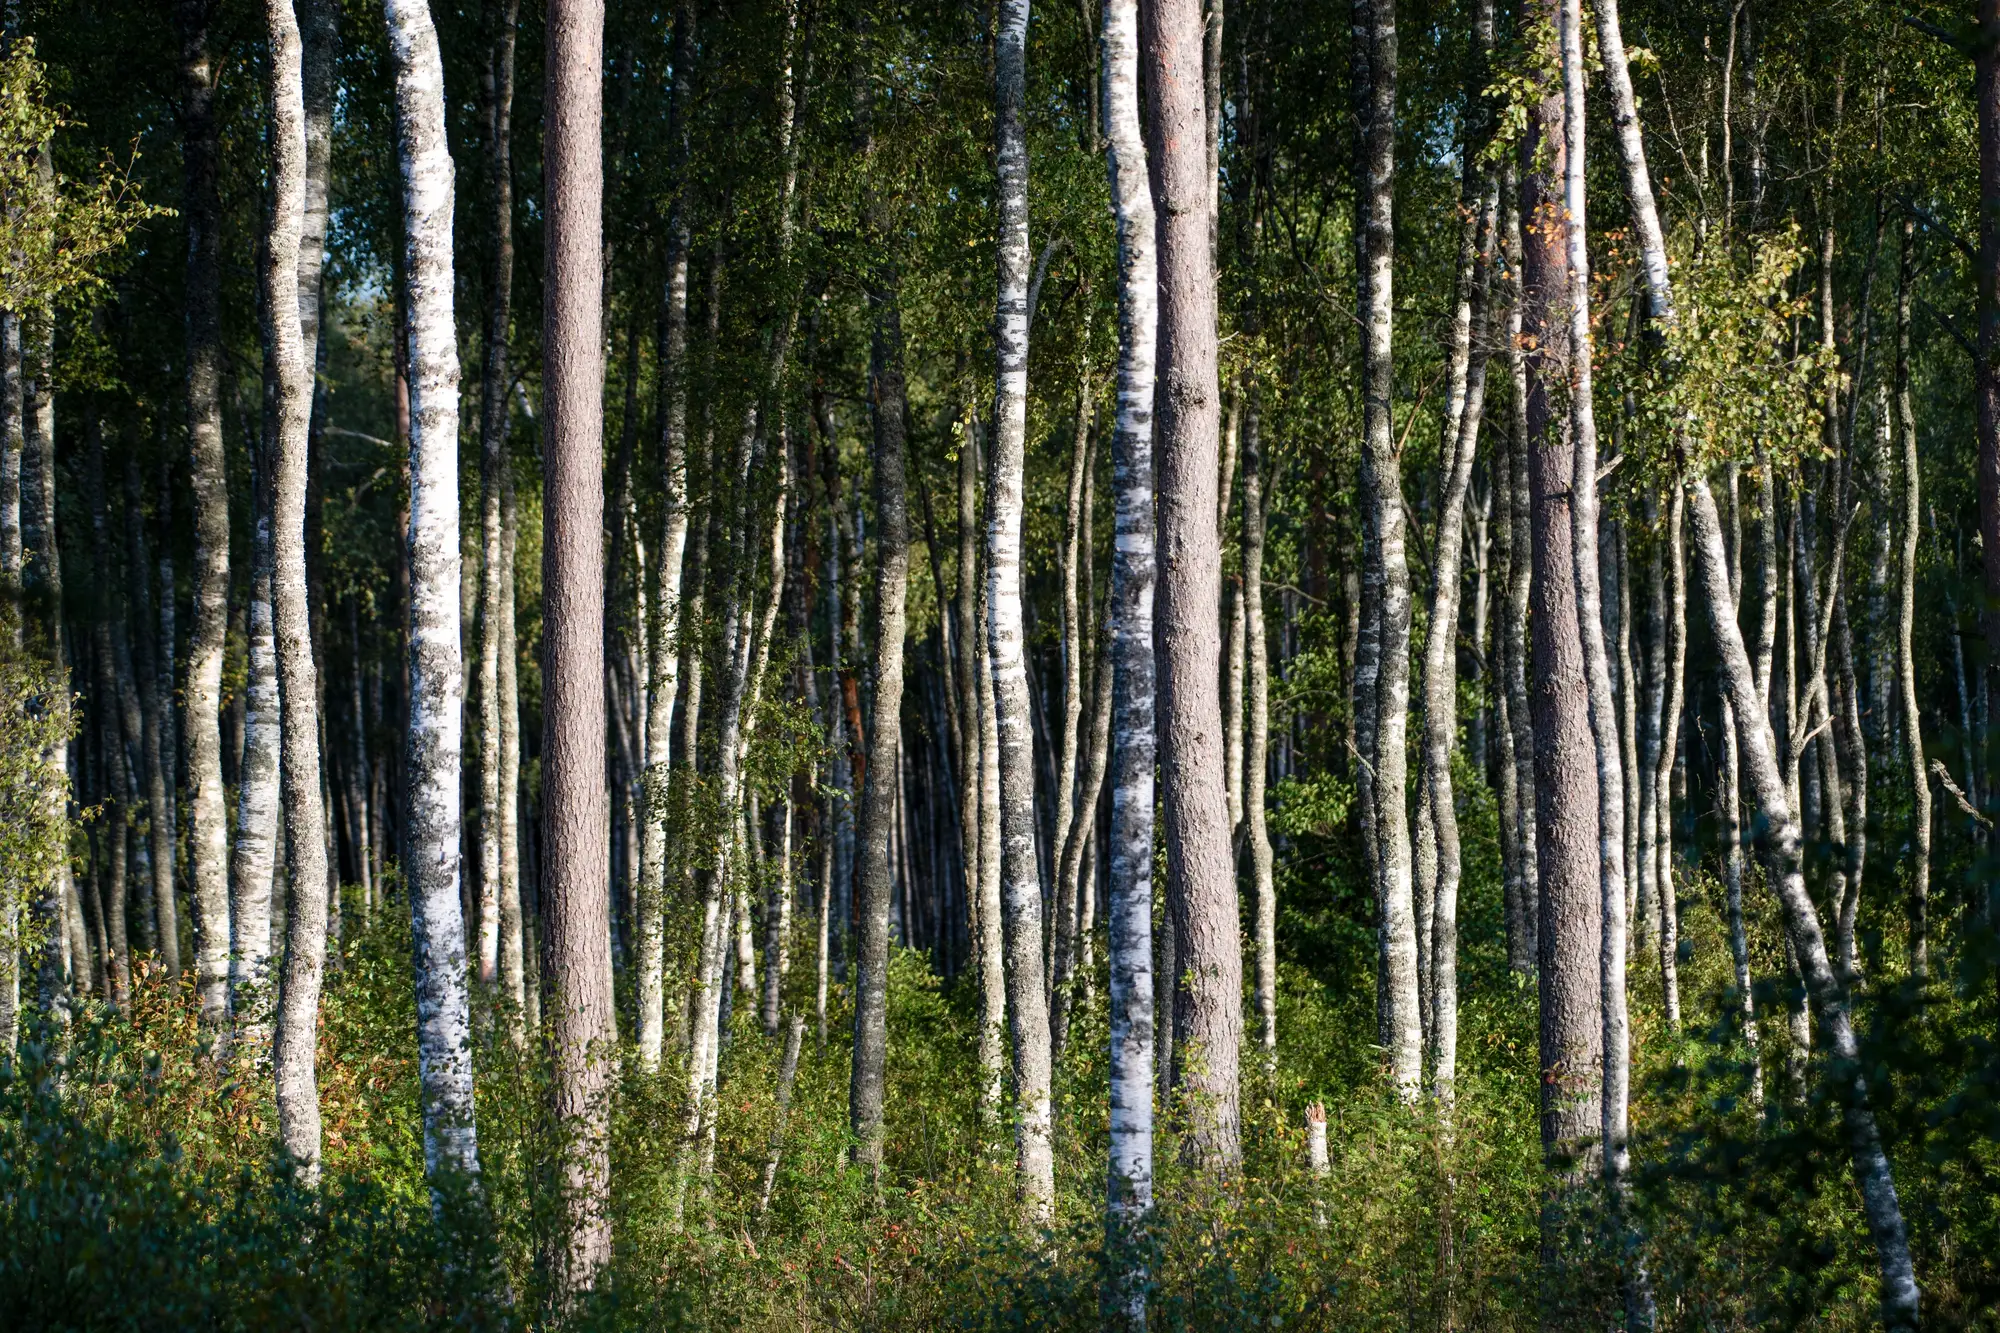
- Conifer
- Broadleaf
- Mixed
- GSD
- 0.5–2 m (high resolution)
- Cadence
- Annual
- Platform
- High-res satellite
- Spectral
- Hyperspectral
Where the plot inventory runs out
You are about to fix next year's harvest mix and the nursery order. The species field for a compartment comes from the planting record, a handful of sample plots and a stand line somebody drew from an aerial photograph some cycles back.
Where a stand is pure, that works. Where conifer has crept into broadleaf, or a thinning has changed the mix, one label or one guessed percentage stands for the whole stand. Nobody disputes the figure in the meeting, because nobody has a better one, and the replanting stock gets ordered against it anyway.
The inventory, step by step
01Deciding what is in a compartment
Sample plots and photo interpretation
Plots are measured on the ground and the results are carried across the stand. Accurate at the plot, an extrapolation everywhere else.
With Tree Species Mapping
Every part of the compartment is classified from one annual pass, so the species share comes from the whole canopy.
Still yoursPlots still tell you height, volume and condition. This layer does not.
02Drawing stand lines
Sample plots and photo interpretation
Boundaries are drawn by eye from aerial photographs and updated when someone gets to that compartment.
With Tree Species Mapping
Species boundary lines come out of the classification for the whole holding at once, ready to compare with your existing stands.
Still yoursDeciding which lines become management boundaries.
03The conifer and broadleaf split
Sample plots and photo interpretation
A percentage typed into the stand record, revisited when a plot is remeasured.
With Tree Species Mapping
An area share by class for each compartment, refreshed with every annual pass.
04Setting harvest mix and replanting stock
Sample plots and photo interpretation
Both are worked out from the extrapolated species figure, with some allowance for what nobody has seen.
With Tree Species Mapping
The plan cites a species layer covering the full holding, and you see where the mix differs from the record before you commit.
Still yoursThe prescription, the felling schedule and the nursery order.
05Habitat reporting
Sample plots and photo interpretation
A species table assembled by hand from the stand database, with a note on how old it is.
With Tree Species Mapping
Species area by compartment exported from the layer for the report.
Still yoursHabitat judgements and the report itself.
What arrives
- GIS layer
Compartment species map
Species composition for every compartment in the holding, from one annual pass.
Feeds the ledger rows on compartment contents and harvest mix.
- Table
Conifer and broadleaf split
Area share by class for each compartment, with the species-level split where the pass can separate species.
Feeds the split and habitat rows.
- Line layer
Species boundary lines
Where one species class gives way to another, delineated so you can lay it over your current stand lines.
Feeds the stand-line row.
- GeoPackage or shapefile
Exportable layer for your GIS
The same data in a form that opens in the GIS you already run, joined to your compartment identifiers.
How it works
Send the holding
Your compartment boundaries as a shapefile or GeoPackage, plus the species field from your database if you want the two compared.
Book the pass
The annual high-resolution acquisition is planned around the phenology window for your region, so it lands when species look most different from each other.
Classification
Narrow-band reflectance and seasonal phenology are used to separate conifer from broadleaf and, where the data allows, species from species.
Delivery
The compartment species layer arrives ahead of your plan review, and the same steps repeat a year later on the same holding.
Limits
Here is what the sample-plot method still does better, and what you give up by switching.
- Mixed stands
- Where two or more species share the canopy, the classification is less certain than in a pure stand. The layer flags those areas rather than forcing a single species label onto them.
- Cloud and daylight
- Optical imagery needs a clear view in the right part of the season. A cloudy window can push the pass or leave gaps, and those gaps are marked.
- One pass a year
- The pass is timed to phenology, once a year. A windthrow in March will not show until the next pass. This is not a way to follow felling or storm damage as it happens.
- Crowns, not individual trees
- At 0.5–2 m a single crown can be one pixel or a handful. The layer classifies stands and patches, and a lone tree in a different species will not be picked out.
- No volume, height or age
- This is a species map. Stocking, volume, tree height and age still come from plots or other surveys.
Who it's for
Switch if
- You manage a holding of compartments and carry a species field in your inventory.
- You plan harvest mix, replanting stock or habitat reporting from that field.
- You want the field checked against the whole canopy before the next plan review.
Stick with plots if
- You need volume, height or age per stand. Plots or a lidar survey do that.
- You need tree-by-tree records, such as a single specimen or a veteran tree survey.
- You need to follow felling, fire or storm damage through the year.
Questions from foresters
Does this replace our sample-plot inventory?
It replaces the step where plot results are carried across a stand to give a species figure. Plots are still how you measure volume and condition, and they are still how you check this layer.
How do we check it against our own ground truth?
Set the layer beside your plots and stand records for the compartments you know best. Tell us where they are when the project is scoped, and they can be compared in the delivery.
How fine is the species split?
It depends on the imagery pass and on the stand. Pure stands separate more cleanly than mixed ones, and some species pairs cannot be told apart. The layer says which classes it separated.
Does cloud cover delay the annual pass?
Yes. Optical imagery needs a clear window in the right part of the season, so the pass is planned around your region's phenology and gaps are marked.
Can we get it more than once a year?
No. The product is built around one phenology-timed pass a year.
How big a holding can you map?
Send the compartment boundaries and the project team will confirm what is feasible for your area.
Will it open in our GIS?
The layer is delivered as GeoPackage or shapefile and opens in QGIS or ArcGIS.
Who owns the layers and the imagery?
Use and ownership terms for the delivered layers are set in the contract before work starts. The imagery sources keep their own licences.
How is it priced?
A project team scopes each holding from the compartment boundaries you send and gives you the terms in writing. Ask in the chat or start a project and they will come back to you.