Broadleaf vs conifer spectral signature, explained
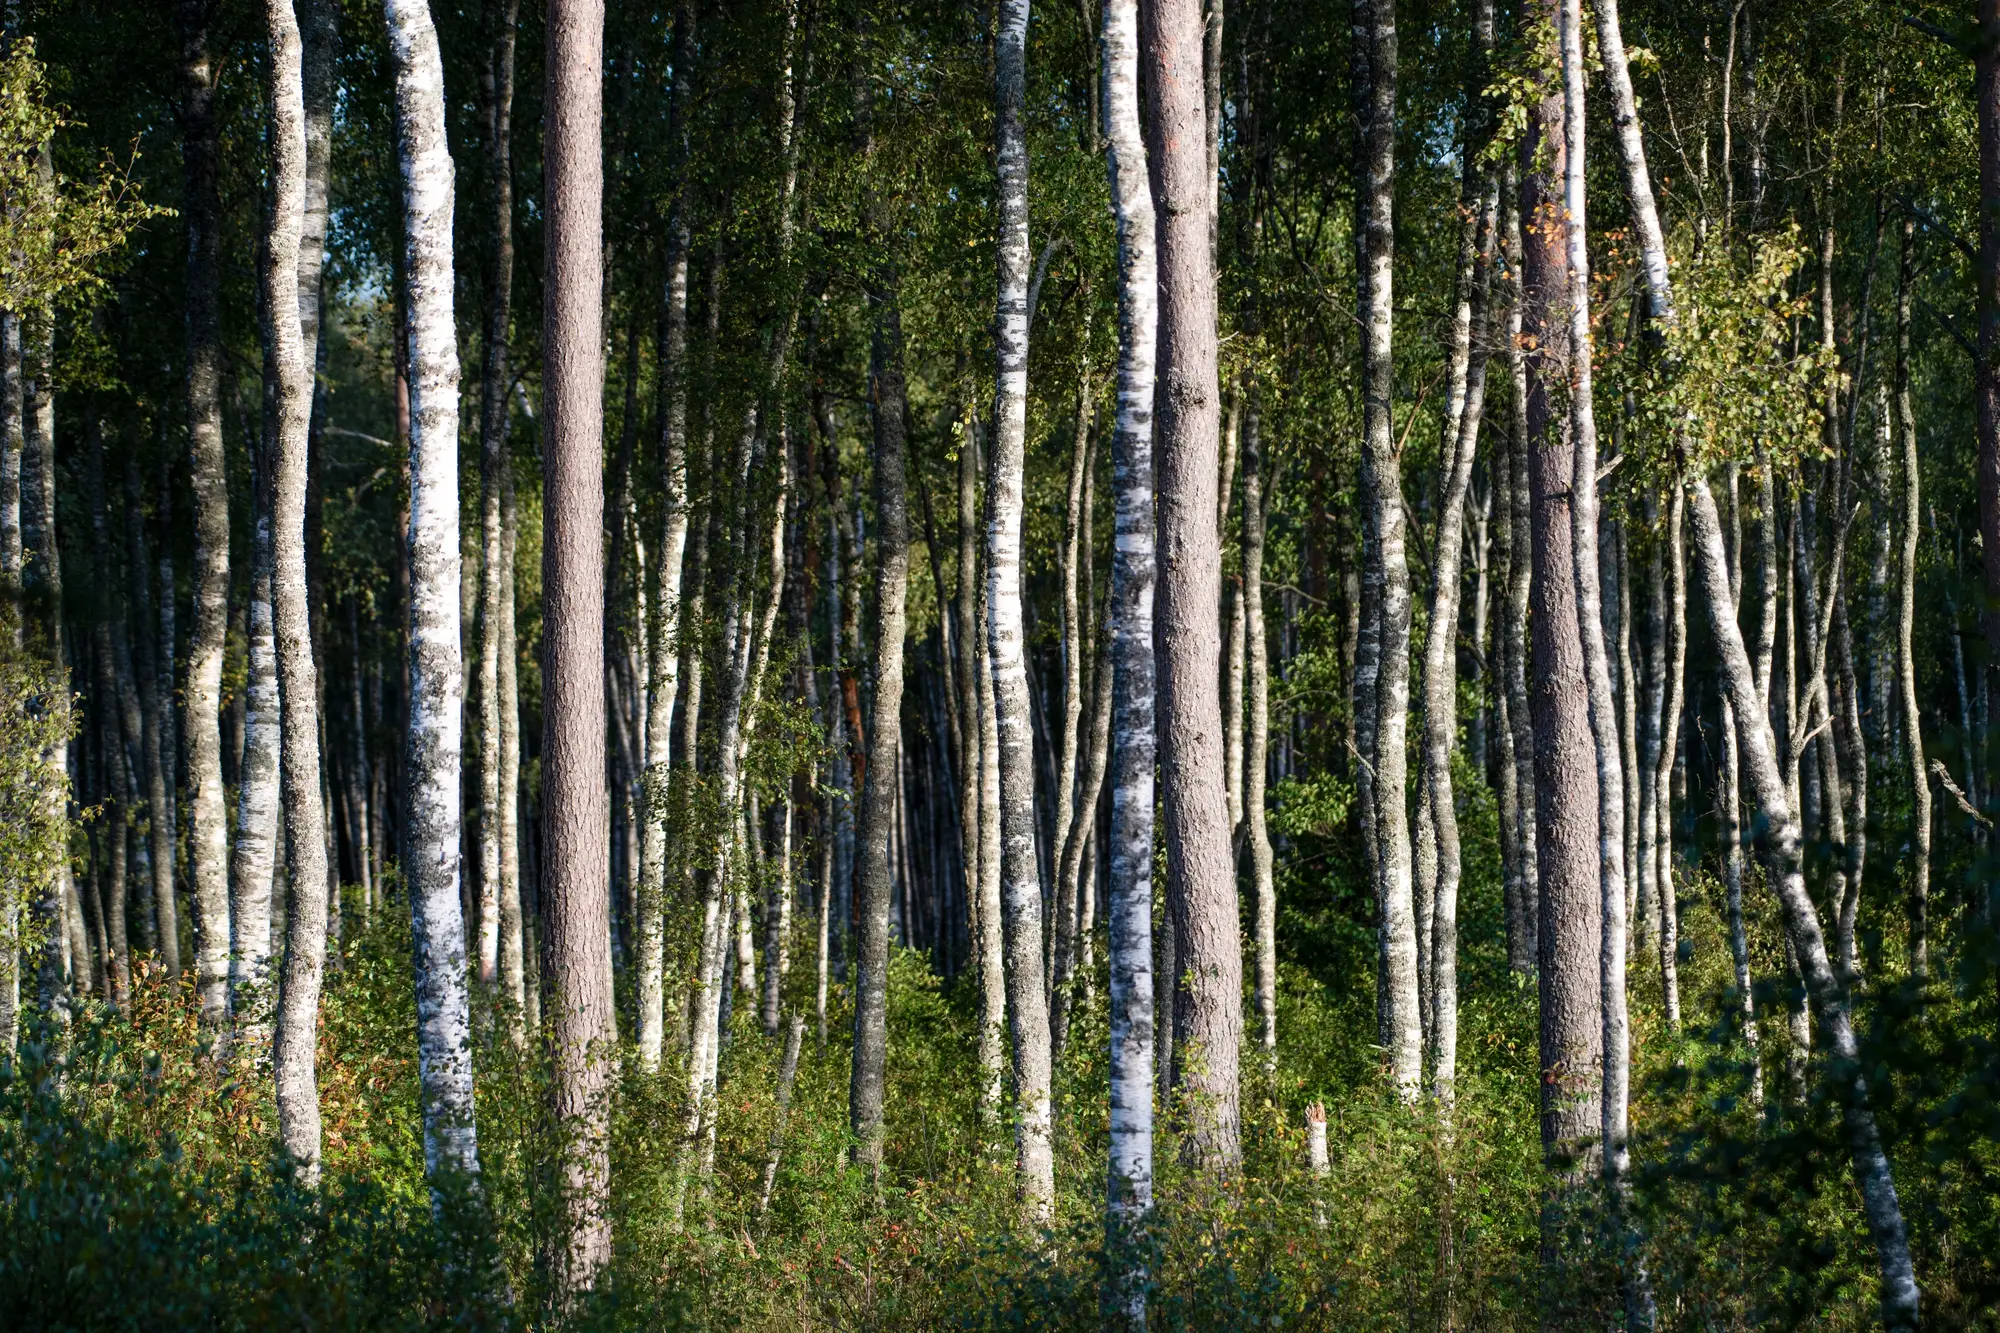
If you've ever pulled a false-color composite and wondered why your cruiser's species calls don't line up with what the pixel says, the answer is usually band width, not bad fieldwork. A standard red/green/blue/NIR sensor sees canopy brightness. It doesn't see the chemistry and leaf structure that separate a red oak stand from a white pine stand standing next to it.
What's different between a broadleaf and a conifer canopy
Start with the leaf itself. A broadleaf leaf has a flat, layered internal structure: palisade mesophyll packed near the top, spongy mesophyll underneath with a lot of air space. That spongy layer scatters near-infrared light hard, which is why healthy hardwood canopies read bright in the NIR band. A conifer needle is a different shape entirely, round or flattened, with a thick waxy cuticle and a much tighter internal structure. Less internal scattering, less NIR bounce. Put the two side by side in an NIR band and the hardwood canopy will usually run brighter, but a standard four-band sensor can't tell you why, and "usually brighter" isn't a classification rule you can hang a compartment map on.
Canopy architecture piles on top of leaf-level chemistry. A closed hardwood canopy shows more shadow-and-gap texture at coarse resolution because of how broadleaf crowns branch and the understory shows through in winter and early spring. A conifer canopy, especially even-aged plantation pine or spruce, reads flatter and uniform, crown to crown. None of that shows up as a single clean threshold either. It's texture and seasonal behavior stacked on top of color, which is exactly the combination that defeats simple band-ratio approaches.
Why narrow-band reflectance forestry separates species
This is where narrow-band sensors earn their keep over a standard multispectral stack. Instead of one wide NIR bucket averaging everything between roughly 760 and 900 nm, a hyperspectral sensor slices that range into dozens of narrow bands and catches the fine absorption and reflectance features that broad bands blur together. The red edge, the steep rise in reflectance right around 700 to 740 nm where chlorophyll absorption drops off, moves at a different rate and lands at a slightly different wavelength depending on leaf pigment mix and internal structure. Broadleaf and conifer canopies shift that edge differently. Pick it up with enough bands and it becomes a usable separator instead of noise.
Seasonal timing does real work here too. Deciduous canopies go through green-up, leaf maturity, and senescence on a schedule that conifers simply don't follow. A narrow-band capture timed to spring green-up or fall color change will show deciduous compartments shifting hard while pine, spruce, and fir stands barely move. Stack a few of those seasonal captures against each other and you're no longer separating two colors in one image. You're separating two different phenology curves, which holds up a lot better across a holding with mixed light conditions and mixed age classes.
What makes a species separable in imagery, and what doesn't
None of this means every species pair resolves cleanly. Two broadleaf species with similar leaf chemistry and similar canopy habit, say a red maple next to a similarly-aged red oak, will sit closer together in spectral space than either does to a conifer. Separability depends on how different the underlying leaf structure, pigment load, and seasonal timing actually are, not on wanting a finer split. Conifer-versus-broadleaf is usually the easiest call a narrow-band classifier makes. Species-within-conifer or species-within-broadleaf gets harder, and how far that split goes depends on the species mix and the time of year captured.
That's the gap this method is built to close: a wall-to-wall composition layer per compartment instead of pushing cruise-plot ratios across acreage you haven't walked. If you're planning harvest mix or replanting stock off a species layer instead of a sample-plot guess, see how Tree Species Mapping builds that layer from narrow-band reflectance and seasonal capture across your holding.