Compartment inventory vs. sample plot cruising: what changes
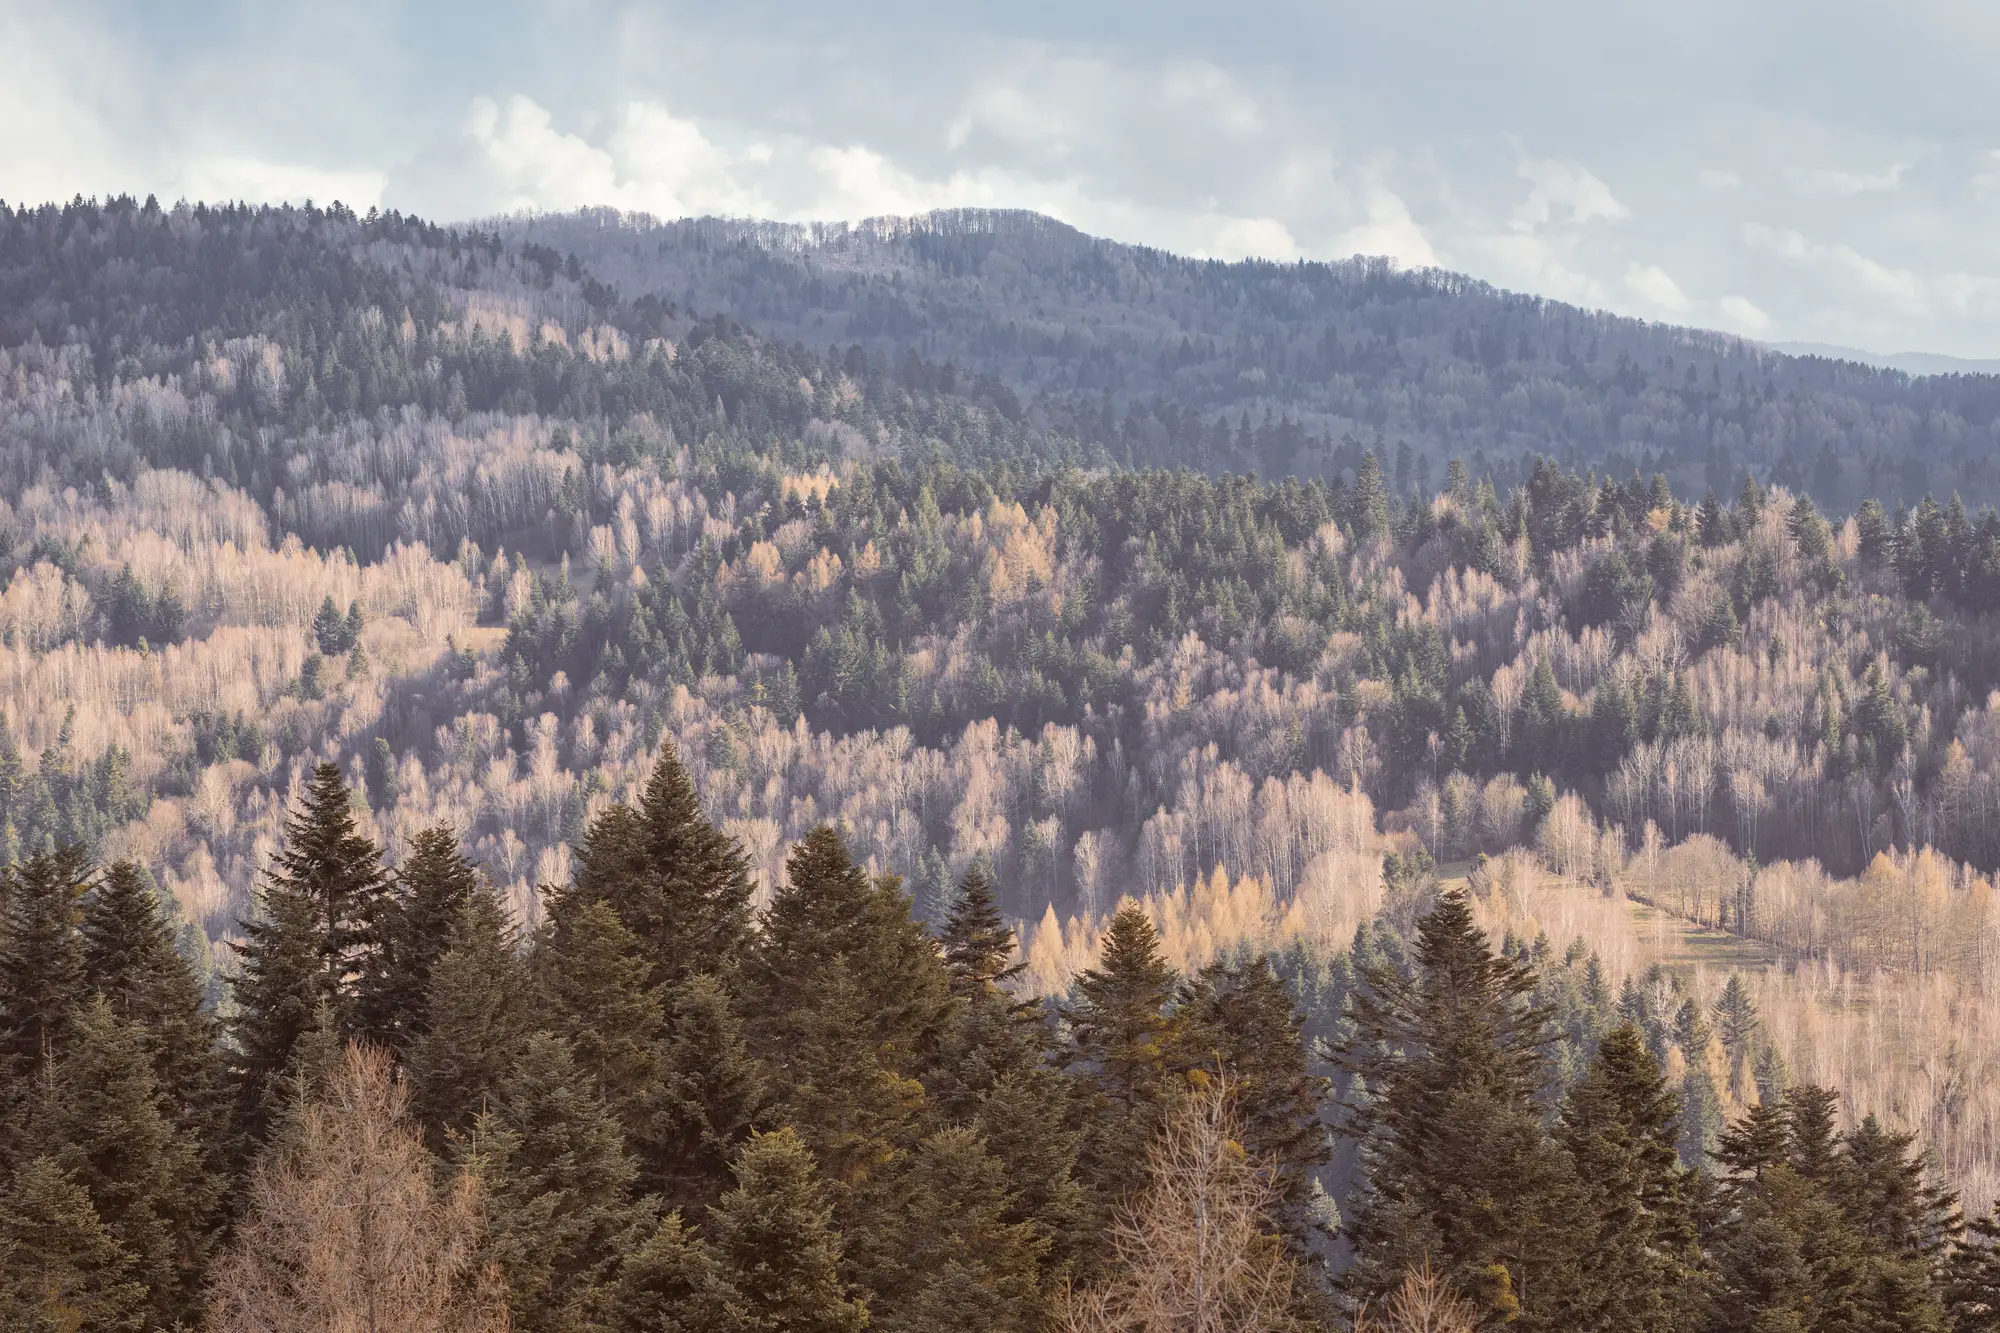
Every forester who's run a cruise crew knows the drill. You stratify the compartment off the aerial photo, drop plots on a grid or run a prism at fixed intervals, tally DBH and species at each point, and expand the numbers to the stand. It works. It's also the reason a 40-acre compartment with three distinct cover types sometimes gets reported as one blended species mix, because the plots that happened to fall in the pine pocket outvoted the two plots that landed in the mixed hardwood draw.
Compartment inventory, the wall-to-wall kind built from remote sensing rather than point sampling, doesn't replace that tally work. It changes what you're extrapolating from.
What a sample plot cruise actually gives you
A cruise is a sample. You walk a known fraction of the compartment, usually somewhere between 5 and 15 percent depending on variability and the intensity your agency or client specifies, and you expand those plot tallies to the whole stand using basal area factor or fixed-area math. That's the entire discipline of biometrics, and it's solid when the stand is reasonably homogeneous.
Where it strains is composition detail at the edges. A cruiser running variable radius plots at 5-chain spacing is going to miss the quarter-acre aspen clone tucked into a conifer stand, or the red oak component that only shows up along a drainage. Those pieces get folded into "mixed hardwood inclusion" on the stand card, or they get missed entirely, because the plot grid wasn't built to resolve them. That's not a flaw in the method. A cruise is designed to estimate volume and stocking for the stand as a unit, not to map every species boundary inside it.
What a compartment-level species layer gives you
A species-composition map built from satellite imagery and seasonal reflectance doesn't sample. It classifies every pixel across the compartment, every year. The conifer/broadleaf split shows up as a line on the ground, not a percentage estimate. Where the phenology separates species, that aspen clone or that drainage-line oak component shows up as its own patch instead of getting averaged into "mixed."
What it doesn't do is give you volume, DBH distribution, or a merchantability call. That's still a cruise's job. The species layer tells you where the species lines fall on the ground before you decide where to stratify or where to walk plots at all.
Where the two methods meet
They aren't competing for the same job. A cruise answers "how much wood, what grade, what's merchantable." A compartment species layer answers "what's standing where, and how does that pattern change compartment to compartment across the holding."
Used together, the species layer can sharpen where a cruise crew stratifies before they ever walk a plot line, since the boundaries between conifer and broadleaf, or between species where phenology separates them, are drawn from the map instead of guessed from a 1980s aerial photo. And at the holding level, a species layer covers every compartment every year, which a sample-plot cruise schedule, run on a 10- or 15-year re-inventory cycle, was never built to do.
If your current pain point is "the stand card says mixed hardwood and I need to know if that's 70 percent red oak or 70 percent red maple before I plan a harvest mix," that's a composition question a plot cruise was never designed to answer precisely, because it's sampling, not mapping.
The practical takeaway
Keep the cruise for volume and grade. If you've been leaning on the species percentages from a decade-old stand exam to plan replanting stock, harvest mix, or habitat reporting across a whole holding, that's the gap a wall-to-wall species layer is built to close, one compartment at a time, updated annually instead of on the cruise cycle.
If species composition across your compartments is the thing you keep having to guess at between cruises, that's exactly what Tree Species Mapping is for.