Norway spruce vs. Sitka spruce: telling them apart from above
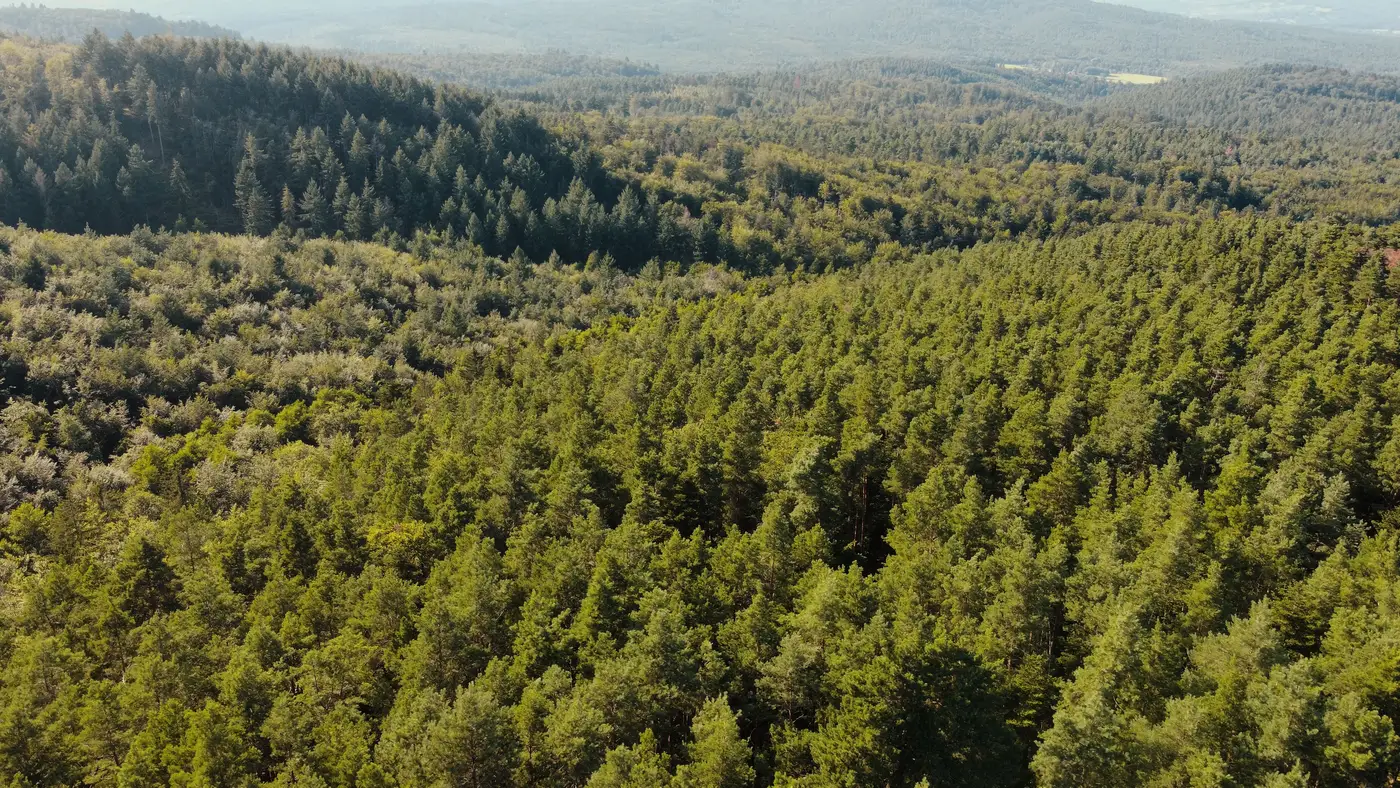
If you've ever tried to call a compartment's species mix off an orthophoto and ended up guessing between Norway spruce and Sitka, you're not missing something obvious. These two look close enough from directly overhead that even an experienced eye on the ground can hesitate, and from a nadir view at typical survey altitude the usual tells get harder, not easier, to read.
Why the confusion happens
Both are even-aged, densely stocked conifers planted in blocks across much of the same ground, often in mixed compartments where one was underplanted into the other decades ago. Needle arrangement, the single most reliable field ID, is useless from above. You can't see whether needles sit all around the shoot (Norway) or flattened into two ranks (Sitka) when you're looking down at a crown instead of a branch.
Bark color and cone shape, the other two classic field marks, are buried under foliage in any image taken during leaf-on conditions. And both species carry a similar blue-green to dark-green canopy color in true color or standard color-infrared composites, which is exactly why compartment records built from a flyover and a hunch drift so far from what's actually standing by the time a cruiser gets out there with a clipboard.
What separates them in canopy imagery
A few things do carry through to the crown level, if you know where to look.
Crown texture is the first. Sitka spruce tends to read rougher and more open in high-resolution imagery, with visible gaps between branch whorls, where Norway spruce often closes up into a tighter crown surface with less visible branch structure. At 0.5–1 m ground sample distance this texture difference is visible but inconsistent. Stand age, spacing, and recent thinning all push texture around enough to fool a texture-only call on any single compartment.
Spectral response is the second, and it's where narrow-band sensors earn their keep. Norway and Sitka spruce diverge slightly but measurably in the near-infrared and red-edge bands, a difference that standard three- or four-band satellite imagery mostly averages away. Hyperspectral or narrow-band multispectral capture picks up enough of that separation to push a classifier past texture alone, especially when paired across a few captures through a growing season rather than one flight.
Phenology is the third, and probably the most useful one nobody puts on a flashcard. Sitka spruce in coastal and upland sites often shows a faintly earlier flush and a slightly different late-season reflectance curve than Norway spruce growing on the same soil. One image can't see this. A stack of images across a season can, which is the whole reason a single summer orthophoto keeps producing the same species confusion year after year.
Where crown-level ID still breaks down
None of this replaces ground truth entirely, and anyone telling you otherwise is overselling a model. Edge trees, suppressed understory stems, and compartments with heavy species intermixing at the individual-tree level will still produce mixed calls, particularly where Norway and Sitka have been planted in alternating rows as a nurse-crop arrangement, which was common practice on a lot of ground now being re-inventoried. A classifier working from canopy reflectance is scoring the dominant and co-dominant crown, not every stem underneath it. That's a real limit worth knowing before you plan a harvest mix or a replanting order off the output.
What it solves is the bigger problem: a wall-to-wall picture of which compartments are predominantly which species across a holding you haven't had boots on in three years. That's the gap between a sample-plot extrapolation and a compartment-by-compartment layer, and it's the specific problem Tree Species Mapping is built to close, using narrow-band reflectance and seasonal capture rather than a single summer flyover.
If your current species records are still extrapolated from a handful of plots and a few good guesses from the last flight, it's worth seeing what an annual, holding-wide species layer looks like before the next cruise goes out.